
NFL Betting Stats: ATS Records and Data-Driven Wagers
 Available in US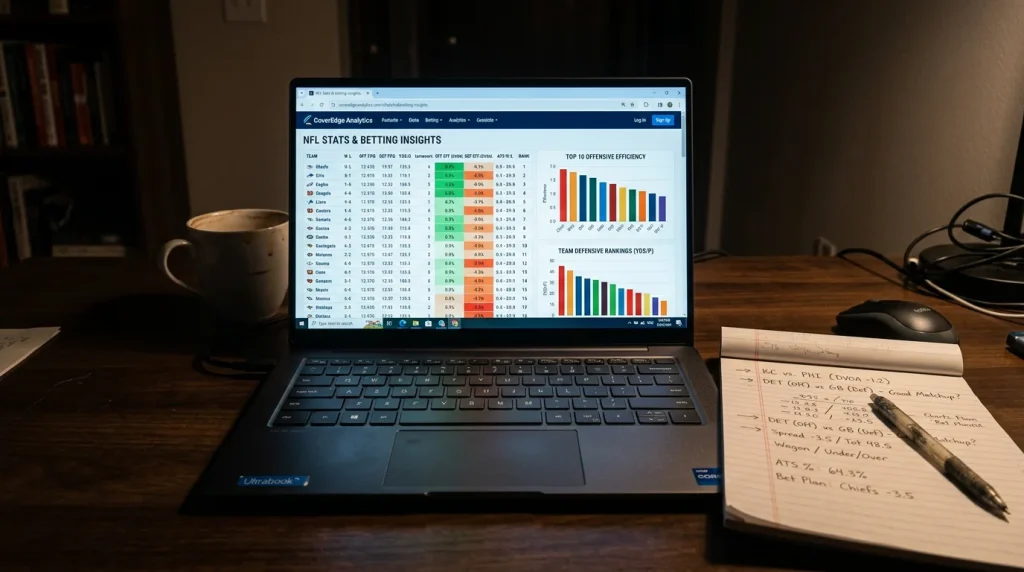
Key NFL Betting Metrics: ATS, DVOA and Efficiency Data
In my second year of serious NFL handicapping, I built a model based entirely on yards per game and points per game. It was tidy, intuitive, and almost completely useless. The correlation between raw yardage and covering the spread was so weak that I would have been better off flipping a coin. That failure forced me to ask a question I should have started with: which statistics actually predict future performance, and which are just noise dressed up as data?
The United States has processed more than $600 billion in legal sports wagers since 2018, with over $165 billion in 2025 alone. That volume means NFL betting markets are priced by people with access to the same raw statistics you have — and better models to process them. If you are using the same basic stats that every television pundit cites on a Sunday broadcast, you are bringing a knife to a gunfight. The edge lives in metrics the public does not use, or in using common metrics in uncommon ways.
Traditional Stats vs Advanced Metrics: What Predicts Wins
The problem with traditional NFL statistics — total yards, total points, win-loss record — is that they are outcomes, not processes. A team that wins 35-3 and a team that wins 17-16 both get the same “W” in the standings, but their performances tell entirely different stories about future expectations.
NFL regular-season viewership hit 18.7 million per game in 2025, and the broadcast graphics overwhelmingly display traditional stats: passing yards, rushing yards, turnovers, third-down percentage. These numbers are easy to understand and satisfying to discuss, but they are contaminated by game script, opponent quality, and random variation. A quarterback who throws for 380 yards in a losing effort while trailing by three scores all game has different predictive value from one who throws for 220 yards while leading wire-to-wire.
The statistics that actually predict future outcomes share a common trait: they measure efficiency rather than volume, and they adjust for context. Yards per play tells you more than total yards. Points per drive tells you more than points per game. And any metric that adjusts for opponent strength — comparing a team’s performance against the defence they actually faced rather than treating all opponents as equal — carries significantly more predictive power than its unadjusted version.
Here is a practical hierarchy, ranked by predictive value for betting purposes. At the top: adjusted net yards per attempt for passing offences and defences, early-down success rate, and turnover-adjusted point differential. In the middle: red-zone scoring percentage, third-down conversion rate, and pressure rate. At the bottom: total yards, time of possession, and raw win-loss record. The bottom tier is what most people use. The top tier is what actually works.
DVOA and EPA: Efficiency Metrics That Matter for Punters
Two acronyms dominate advanced NFL analytics, and understanding them — even at a surface level — will put you ahead of 90% of UK punters betting on the league.
DVOA stands for Defence-adjusted Value Over Average. Developed by Football Outsiders, it measures a team’s efficiency on every single play, compares it to the league average, and adjusts for the quality of the opponent faced. A team with a 15% offensive DVOA is performing 15% above average on a per-play basis against the defences they have actually encountered. The adjustment for opponent strength is what makes DVOA valuable — it strips out the noise of playing weak schedules or feasting on garbage time.
DVOA is published weekly during the season and is freely available. I use it primarily as a ranking tool: sorting teams by offensive, defensive, and special-teams DVOA gives me a more accurate picture of relative team quality than the standings alone. When the DVOA rankings diverge significantly from the public perception reflected in the betting lines, that divergence often signals a mispricing worth investigating.
EPA, or Expected Points Added, takes a different approach. It assigns a point value to every play based on the game situation — down, distance, field position, score — and measures how much each play increased or decreased a team’s expected points. A ten-yard completion on third-and-eight is worth more EPA than a ten-yard completion on first-and-ten, because the former sustains a drive while the latter merely moves the chains.
EPA per play is the single most useful number I track. It distils a team’s offensive or defensive quality into one figure that accounts for context, adjusts for situation, and updates weekly. When I see a team with a top-five EPA per play on offence but a middling win-loss record, I know the wins are likely to come — and the market may not have caught up yet.
Neither DVOA nor EPA is perfect. Both can be skewed by small sample sizes early in the season, and both have blind spots around coaching adjustments, scheme changes, and personnel losses that have not yet shown up in the play-by-play data. Use them as inputs, not as answers.
Applying Stats to NFL Betting Decisions
On DraftKings, NFL betting exceeded every other league in handle during 2024, despite the NFL having the fewest games per team. That concentration of volume means the statistical edge you bring to each game matters more — there are fewer opportunities, so each one needs to count.
Here is my weekly process, simplified. On Tuesday, I pull updated DVOA rankings and EPA-per-play figures for every team. I compare these to the opening lines for the upcoming week. If a team’s efficiency metrics suggest they should be a three-point favourite but the line is only one point, I investigate further — checking injury reports, weather forecasts, and situational factors. If the discrepancy holds after that deeper analysis, I have a candidate bet.
I also track specific statistical mismatches that the market tends to underweight. Offensive line performance — measured by sack rate allowed and rushing yards before contact — is chronically underpriced because it is less visible than quarterback play. A team with an elite offensive line facing a defence with a poor pressure rate will sustain drives and control the clock, a dynamic that affects both the spread and the total but often is not fully captured in the posted line.
Turnover differential is a trap statistic for bettors. Season-long turnover differential correlates strongly with wins but poorly with future wins. Turnovers are heavily influenced by luck — fumble recovery rates hover near 50% regardless of team quality, and interception rates fluctuate wildly year to year. A team that leads the league in turnover differential at midseason is likely to regress, which means their record overstates their true quality. Betting against teams with unsustainably positive turnover margins is one of the most reliable contrarian angles in NFL handicapping.
The best use of statistics is not to build a model that spits out a number and tells you what to bet. It is to build a framework that identifies where the market’s assumptions differ from what the data shows, then to investigate those discrepancies with additional context. The stats do the screening. Your judgement does the final evaluation. For how those edges translate into wagering approaches, the strategy piece covers the application side in detail.
What is DVOA and how does it apply to NFL betting?
DVOA — Defence-adjusted Value Over Average — measures a team"s per-play efficiency relative to the league average, adjusted for the quality of opponents faced. It is published weekly and available free from Football Outsiders. For betting, DVOA provides a more accurate picture of team quality than win-loss record or raw yardage stats, helping you identify teams whose true performance level differs from public perception and the current betting line.
Where can UK punters find free NFL advanced stats?
Football Outsiders publishes free weekly DVOA rankings during the NFL season. Pro Football Reference offers comprehensive EPA data, play-by-play logs, and historical statistics. nflfastR provides open-source play-by-play data for those comfortable with basic data analysis. The NFL"s own website publishes Next Gen Stats including player tracking data. All of these sources are freely accessible from the UK without a subscription.
Articles
Created by the "American Football Betting Online" editorial team.
