
UK NFL Player Props Betting: Yards, TDs and Player Stats
 Available in US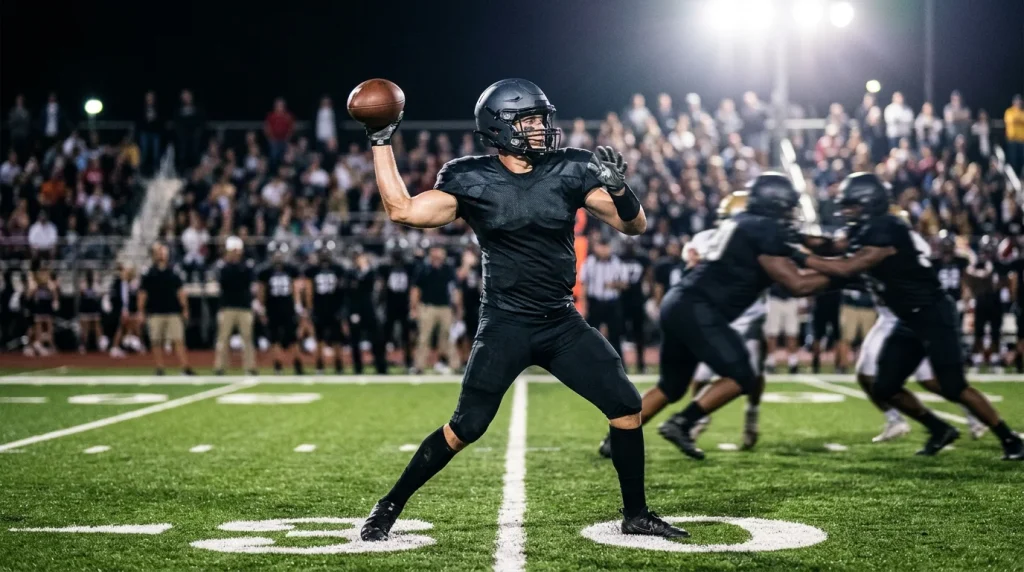
NFL Player Props Markets: Passing, Rushing, and Receiving Bets
Three seasons ago, I placed a bet on a backup running back to go over 47.5 rushing yards in a Thursday night game. His starter had been ruled out at 4pm — barely two hours before kick-off — and the sportsbook had adjusted the game spread but hadn’t touched the backup’s rushing yard line. It was still set at a number reflecting his usual 6-8 touches per game, not the 18-22 he was about to receive as the lead back. I backed the over at 1.87 and he finished with 94 yards. That is the player prop market in microcosm: individual performance bets where preparation, timing and attention to detail create genuine edges that team-level markets rarely offer.
The american football betting market reached $8.52 billion in 2025 and is projected to hit $14.49 billion by 2030. Player props are driving a disproportionate share of that growth because they appeal to a different kind of bettor — someone who knows the players, follows the matchups and wants to bet on specific performances rather than game outcomes. On DraftKings during the 2024 season, NFL wagering surpassed all other leagues by volume despite the sport having fewer games. Props were a major contributor to that dominance.
For UK punters, player props represent the sharpest departure from traditional betting. In football, you back a team to win, draw or lose. In NFL props, you back a single player to exceed or fall short of a statistical benchmark — and the factors that determine the outcome are often unrelated to which team wins. A quarterback can throw for 350 yards and lose. A running back can rush for 40 yards and win. Props strip away the team narrative and reduce the bet to one question: will this player’s performance exceed the sportsbook’s expectation? That clarity, once you’re comfortable with it, is addictive.
Types of NFL Player Props: A Market-by-Market Breakdown
Walk into any UK sportsbook’s NFL section during game week and you’ll see player props organised by position. The categories are consistent across operators, though the depth varies. Here’s what the landscape looks like and why each market behaves differently.
Passing yards is the most liquid player prop market. The sportsbook sets a line — say 265.5 yards — and you bet over or under. The line is derived from the quarterback’s seasonal average, adjusted for the opposing defence’s pass-defence ranking, home/away splits, weather conditions and game script expectations. A game where both teams are expected to score freely produces a higher passing yard line than a game projected to be a defensive grind.
Passing touchdowns work on the same over/under structure but with much smaller numbers. A typical line might be 1.5 or 2.5 touchdowns. The difference between 1.5 and 2.5 is enormous — a quarterback averaging 2.1 touchdowns per game is a strong over on 1.5 but a marginal under on 2.5. These markets are binary in feel: you’re essentially betting whether the quarterback has a good day or a great day.
Rushing yards for quarterbacks is a newer market that has exploded in popularity alongside the rise of mobile signal-callers. Lines tend to be low — 20.5 to 35.5 yards for the most athletic passers — and the variance is high because designed runs and scrambles are situational. I find these markets interesting but difficult to model consistently.
Running back rushing yards is the prop market I bet most frequently. The line reflects expected carries multiplied by an efficiency estimate. If a back averages 4.5 yards per carry and the sportsbook expects 18 carries, the line might sit around 78.5. What the line doesn’t always capture is game-script dependence: if the team falls behind, they abandon the run, and the rushing total craters regardless of the back’s talent. Conversely, a team protecting a lead in the second half will feed the running back to chew clock, inflating totals beyond what the pre-game line anticipated.
Receiving yards and receptions cover wide receivers, tight ends and pass-catching running backs. These are the most volatile prop markets because targets — the primary driver of receiving production — are distributed unpredictably. A receiver might be schemed for 10 targets in the game plan but receive only 4 because the defence doubles him. Or a slot receiver might see a sudden surge in targets because the defence prioritises the outside threats. Receptions are slightly more predictable than yardage because they strip out the variance of long plays.
Anytime and first touchdown scorer markets round out the standard prop offering. Anytime touchdown bets ask whether a player will score at least one touchdown during the game. First touchdown scorer bets, which typically offer higher odds, ask whether a specific player will score the game’s first touchdown. These are popular markets but carry wide margins — I’ll cover why in the pricing section below.
Quarterback Props: Passing Yards, Touchdowns and Interceptions
I once spent an entire Wednesday evening building a spreadsheet model for quarterback props, cross-referencing each starting QB’s home/away splits, opponent pass-defence rankings and weather forecasts. By Thursday morning, the model had flagged three games where the passing yard lines seemed off by 15+ yards. Two of the three overs hit. The third was a blowout where the winning team ran the ball in the second half and the quarterback sat on the bench for the final quarter. That’s quarterback props in a nutshell: the edge is real, but game script can override everything.
The NFL’s average game viewership hit 18.7 million in 2025, and quarterback performance is the primary reason people tune in. That popularity means quarterback props attract the most recreational money and therefore the most attention from sportsbook odds compilers. Lines are sharp. Beating the passing yards line consistently requires more than just checking the season average — you need to understand the specific defensive matchup.
Against defences that play man-to-man coverage, quarterbacks with accurate intermediate throws tend to produce higher yardage. Against zone-heavy defences, the game often involves shorter, more frequent completions that accumulate yardage gradually. The total matters, but the route to getting there differs — and that difference affects the distribution of outcomes. A quarterback who gets his yards through 35 short completions has a tighter range of outcomes than one who relies on 5-6 big plays. The sportsbook’s line is the same for both, but the variance profile is completely different.
Interception props deserve a brief mention because they’re a trap market. Interceptions are among the most random events in football — a tipped pass, a misjudged wind gust, a receiver running the wrong route. The sample size within any single game is too small to model reliably. I avoid interception props entirely and focus my quarterback analysis on yards and touchdowns where the outcomes are more closely tied to skill and scheme rather than luck.
One practical tip: check the weather forecast. Wind speeds above 15 mph measurably reduce passing efficiency and yards. If a game is being played at an outdoor stadium with significant wind, passing yard unders become substantially more attractive. The sportsbook adjusts for weather, but in my experience, the adjustment is often insufficient — they’ll drop the line by 10 yards when the historical data suggests 20-25 would be more appropriate.
Running Back and Receiver Props: Rushing and Receiving Yards
Here’s a scenario that plays out multiple times every NFL Sunday. A running back is listed as questionable on Friday’s injury report with a knee issue. His backup is a capable but unheralded player. By Saturday evening, the starter is downgraded to doubtful. The sportsbook adjusts the starter’s rushing yards line downward but doesn’t significantly move the backup’s line upward — or sometimes doesn’t list the backup at all until late Sunday morning. If you’ve done your homework on the backup’s per-carry efficiency and the team’s run-blocking scheme, that lag creates a window.
Running back rushing props are driven by two variables: expected carry volume and yards-per-carry efficiency. Volume is the more predictable of the two. Teams with established bell-cow backs (one running back handling 70%+ of carries) produce more consistent rushing totals than committees (two or three backs splitting work). When evaluating a rushing yard line, my first question is always: how many carries will this player get? If I estimate 20 carries and the sportsbook’s line implies 16, there’s a discrepancy worth investigating.
Game script is the wild card. Teams trailing by two or more scores typically abandon the run, which can cut a running back’s second-half carries from 8 to 2. Conversely, teams with comfortable leads feed the run game to milk clock. The pre-game spread is your best proxy for expected game script: if a team is a 7-point favourite, their running back is likely to see above-average volume because the team is expected to lead for most of the game.
Receiver props — both yardage and receptions — are the most volatile and therefore the hardest to beat consistently. Target share is the key metric: what percentage of the team’s pass targets does this receiver typically receive? A number-one receiver with a 28% target share has a more stable production floor than a secondary receiver at 15%. But target share alone doesn’t capture the quality of those targets. A receiver who runs primarily deep routes might average 5 targets for 80 yards per game — high yardage per target but also high variance because one uncatchable deep ball can swing the total by 30+ yards.
My best approach for receiver props: focus on receptions rather than yards for receivers with high target volumes, and yards for receivers with lower volumes but higher yards-per-reception averages. The markets are priced similarly in terms of margin, but the underlying variance profiles suit different analytical approaches. A slot receiver averaging 7 receptions per game with tight variance is a better candidate for a receptions over bet than a deep-threat receiver averaging the same number but with a range of 3-12.
How to Research Player Props: Stats That Matter
Jim Strode, an associate dean at Ohio University’s College of Business, observed that the constant visibility of betting partnerships in NFL broadcasts — the DraftKings commercials during every break, the odds graphics during analysis segments — has changed how fans interact with the sport. He’s right, and the implication for props is significant: more fans betting means more recreational money flowing into prop markets, which in turn creates more opportunities for punters who are willing to do the analytical work the casual bettor skips.
The stats that drive my prop analysis fall into three categories: player-level performance metrics, opponent matchup data and situational context. Player-level metrics include season averages, home/away splits, recent form (last 3-5 games) and snap counts. These establish a baseline. If a quarterback averages 260 passing yards per game at home and 235 on the road, that 25-yard gap needs to be reflected in the line.
Opponent matchup data is where the real edges emerge. Every NFL defence has weaknesses that can be quantified. Some defences allow a high completion rate but low yards per completion — the bend-don’t-break approach that limits explosive plays. Others allow chunk yardage but are stingy in the red zone. Matching a player’s strength against the specific weakness of the defence he’s facing produces the most reliable over/under assessment. Since the repeal of PASPA in 2018, the US has processed over $600 billion in cumulative legal sports bets, and the analytical infrastructure built around that volume — free stat sites, play-by-play databases, efficiency models — is available to anyone with an internet connection.
Situational context is the final layer. Is the game indoors or outdoors? What’s the expected game total? Is a key offensive lineman injured, potentially reducing run-blocking quality or pass-protection time? Has the opposing defence just lost a starter at a position that directly matches up with the player you’re evaluating? These contextual factors aren’t always captured in the line because they require manual assessment — the sportsbook’s algorithm prices the model output, but the model doesn’t know that the left tackle is playing through a groin injury he didn’t practise with on Wednesday.
The research process takes time. For a serious prop card, I spend 30-45 minutes per game, reviewing the relevant stats, checking injury reports and identifying one or two props where my assessment diverges from the market. That’s not sustainable for every fixture on the slate. I typically deep-dive on three or four games per week and leave the rest alone. Selectivity is the single most important discipline in prop betting — and the one most punters ignore because it feels like leaving money on the table when every game has player props begging for action.
Pricing Traps: Where Sportsbooks Build Their Margin on Props
Sportsbooks are not charities, and prop markets are where they make some of their highest margins. Understanding where and how they build that margin is essential to avoiding the traps that cost recreational bettors season after season.
The primary pricing trap is the correlated-probability discount in bet builders. When you combine a quarterback’s passing yards over with the team’s total over in a same-game parlay, those outcomes are positively correlated — if the passing yards hit, the team total is more likely to hit too. Sportsbooks know this and discount the combined odds accordingly. The discount is opaque — you can’t see how much they’ve shaved off — and in my experience, it ranges from 8% to 20% depending on the operator and the specific combination. That means your same-game parlay is paying you less than the true combined probability of the outcomes justifies. For a deeper look at how these combinations work and where the correlation adjustments hide, I’ve explored that in how NFL same-game parlays and bet builders are structured.
The biggest UK operators spend heavily on customer acquisition — advertising, sponsored content, promotional offers — and that cost has to be recouped somewhere. Prop markets, with their lower liquidity and less scrutiny from sharp bettors, are a natural place to widen margins. Smaller, product-focused sportsbooks that compete on pricing rather than brand awareness sometimes offer noticeably tighter prop odds because their cost structure allows it. If you’re betting props seriously, comparing lines across three or four sportsbooks before placing every bet is not optional — it’s the difference between paying a 5% margin and a 9% margin on the same outcome.
Touchdown scorer markets carry the widest margins in the prop landscape. The anytime touchdown scorer market might list a running back at 1.80 when the true probability, based on red-zone opportunity share and historical scoring rate, suggests he should be priced at 1.95 or higher. First touchdown scorer markets are worse — the added unpredictability of who scores first (which is essentially random among the 4-5 most likely scorers) means the sportsbook can price every candidate below their true probability and still attract heavy volume from punters chasing the bigger number.
Yardage line placement is another subtle trap. Sportsbooks often set lines at psychologically attractive numbers — 99.5 rushing yards, 199.5 passing yards, 49.5 receiving yards — that sit just below round milestones. Bettors who see “99.5 rushing yards” feel like they’re getting a good number because 100 sounds achievable. But the line isn’t set at 99.5 because the oddsmaker expects the player to rush for around 100. It’s set there because the probability distribution suggests the over and under are roughly balanced at that point, and the near-miss of a round number creates the psychological illusion of value on the over side. Beyond passing and rushing yards, punters can find lucrative opportunities by diving into specific touchdown scorer markets for both teams.
Building a Sustainable Prop Betting Approach Across the NFL Season
The NFL regular season runs 18 weeks. That’s 272 games if you count every fixture. Each game generates a dozen or more player props worth evaluating. The temptation is to bet constantly — a passing yards over here, a rushing total under there, maybe a touchdown scorer pick for fun. I’ve been through that phase, and it ended with a losing season and a spreadsheet that revealed I was placing 40+ prop bets per week with no consistent edge on most of them.
The approach that works — and I’ve now tested it across four full seasons — is disciplined selectivity. I research 3-4 games per week in depth. From those games, I identify 2-3 props where my analysis disagrees with the market by a meaningful margin. I bet only those. Over an 18-week season, that produces roughly 40-55 prop bets — enough to generate meaningful returns if your strike rate is above break-even, but few enough that each bet receives genuine analytical attention.
Track everything. Every prop bet, every outcome, every line you took versus the closing line. After the season, review which market types — passing yards, rushing yards, receptions, touchdowns — you performed best in and which you should abandon. My own data shows I’m consistently profitable on running back rushing props and quarterback passing yards but break-even or worse on receiving props and touchdown scorers. That self-knowledge shapes next season’s approach. The data doesn’t lie, even when it tells you to stop betting a market you enjoy. Compare the best prop odds across top UK sportsbooks using our premier NFL betting resource to ensure maximum returns.
What are NFL player props and how do I bet on them?
Player props are bets on individual player performances rather than game outcomes. You wager on whether a player will exceed or fall short of a statistical line set by the sportsbook — for example, a quarterback going over or under 265.5 passing yards. Most UK-licensed sportsbooks offer player props for NFL games through their standard betting interface.
Which NFL player prop markets are available at UK sportsbooks?
Standard UK sportsbook offerings include quarterback passing yards, passing touchdowns, rushing yards for running backs, receiving yards, receptions, anytime and first touchdown scorer. Some operators also offer interception props, longest completion, quarterback rushing yards and defensive player props. Market depth varies between operators and increases for primetime fixtures.
How do injuries affect NFL player prop odds?
Injuries can significantly shift prop lines. If a starting running back is ruled out, his backup"s rushing line may rise while the team"s passing props could also adjust. Lines typically move fastest once official injury designations are released on Friday afternoons and when final inactive lists are confirmed 90 minutes before kick-off on game day.
Are quarterback props more profitable than skill position props?
Quarterback passing yard props tend to produce more consistent analytical edges because the sample of passing attempts per game is large enough to model reliably. Running back rushing props also offer strong analytical potential. Receiving props and touchdown scorer markets carry higher variance and wider bookmaker margins, making consistent profitability more difficult.
Articles
Created by the "American Football Betting Online" editorial team.
